
Strategy (NASDAQ: MSTR) stock price dropped by 4.24% on October 26 to close trading at $139. The shares were up slightly in pre-market trading at the time of writing, but the weakness in Bitcoin (BTC) price below $80,000 continues to weigh on sentiment.
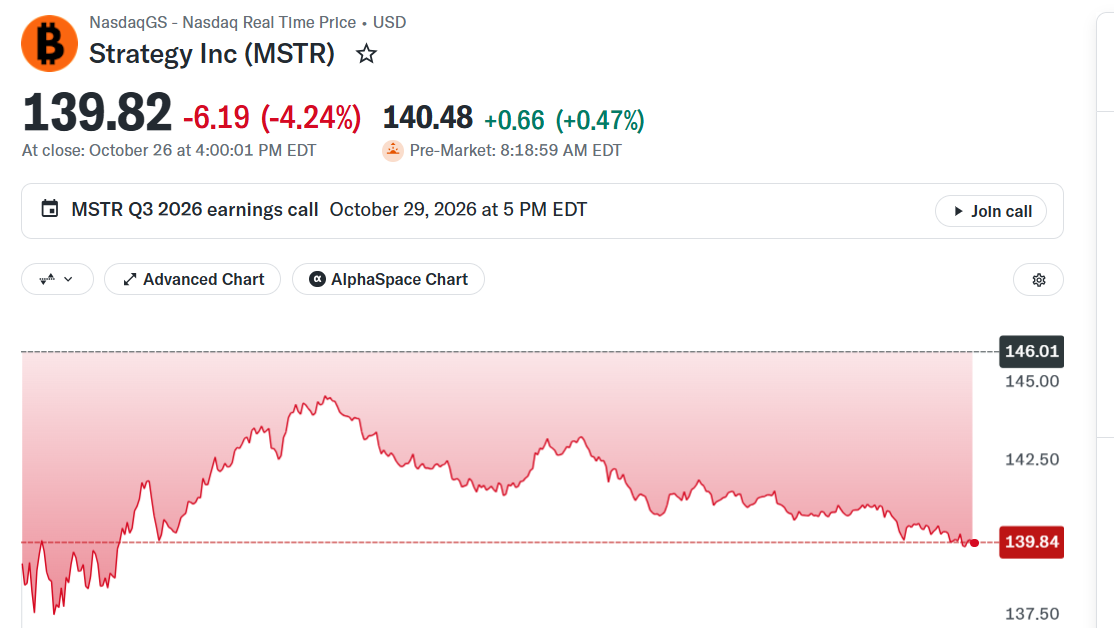
MSTR stock weakness comes ahead of a busy week for Strategy as shareholders get ready to vote on the STRC daily dividend payout proposal tomorrow, October 28. The vote will take place one day before Strategy releases its Q3 2026 earnings on October 29.
Meanwhile, a Wall Street investment firm has reiterated a buy rating on Strategy shares even as the firm pauses BTC purchases.


MSTR Stock Defends $140 Ahead of Dividend Vote
MSTR stock price has bounced above $140 in pre-market trading. Past data since September 16 suggests that sub-$140 levels tend to attract buyers.
The bounce to this psychological level comes ahead of a crucial vote on October 27. As we reported earlier, MSTR stock holders will be voting on whether to allow daily dividend payouts for STRC and other preferred stocks.
The vote starts off with a strong leaning on the “yes” side because Strategy’s executive chairman, Michael Saylor, holds 32.9% of the voting power.
If the proposal passes, it could be bullish for MSTR stock price because daily dividends could increase demand for STRC, which could, in turn, push the preferred stock’s price to its par value of $100. STRC dropped by 0.19% on October 26, and was up slightly in pre-market trading.
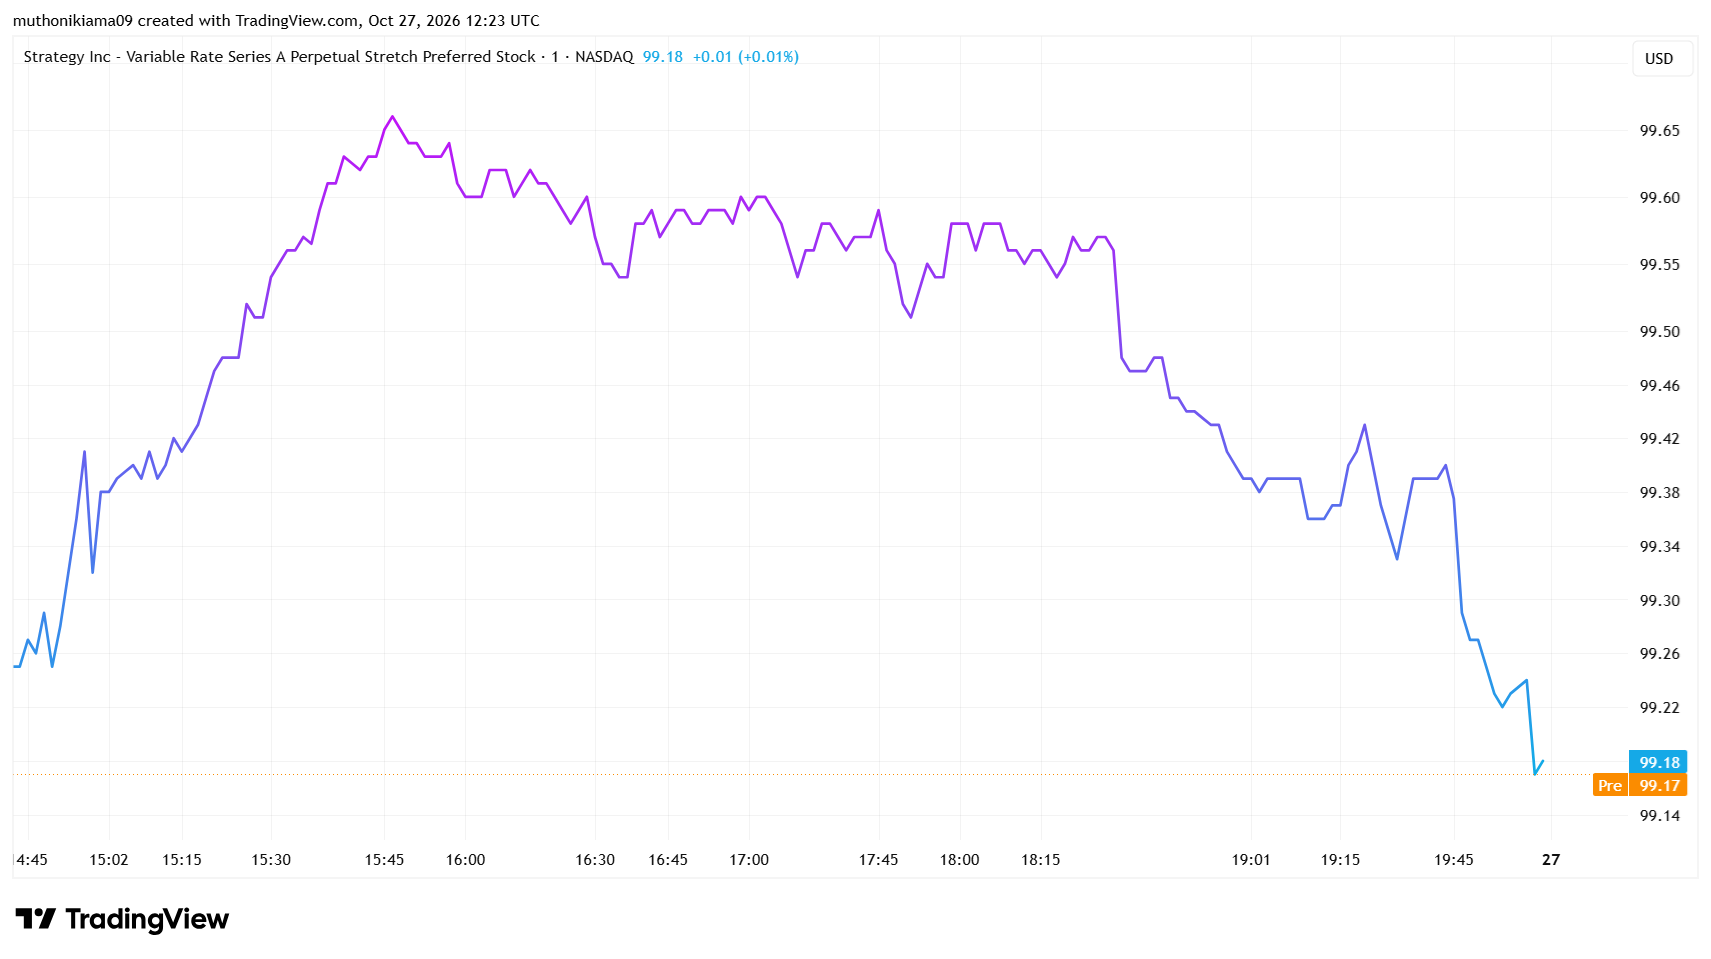
Strategy will also be able to raise more capital to purchase Bitcoin if the demand for the STRC stock increases. This will also bode well for MSTR stock price.


StoneX Raises MSTR Target Ahead of Earnings
StoneX analyst Mark Palmer has reiterated a buy rating on MSTR stock, and set a $435 price target.
Palmer bases his bullish outlook on two things: the upcoming Q3 earnings results on October 29, and the revamped funding model for Strategy’s BTC purchases.
Wall Street analysts expect Strategy to report an Earnings per Share (EPS) of between $17.25 to $22.89. Data from Polymarket also shows that 90% of traders are betting that Strategy will beat these earnings expectations.
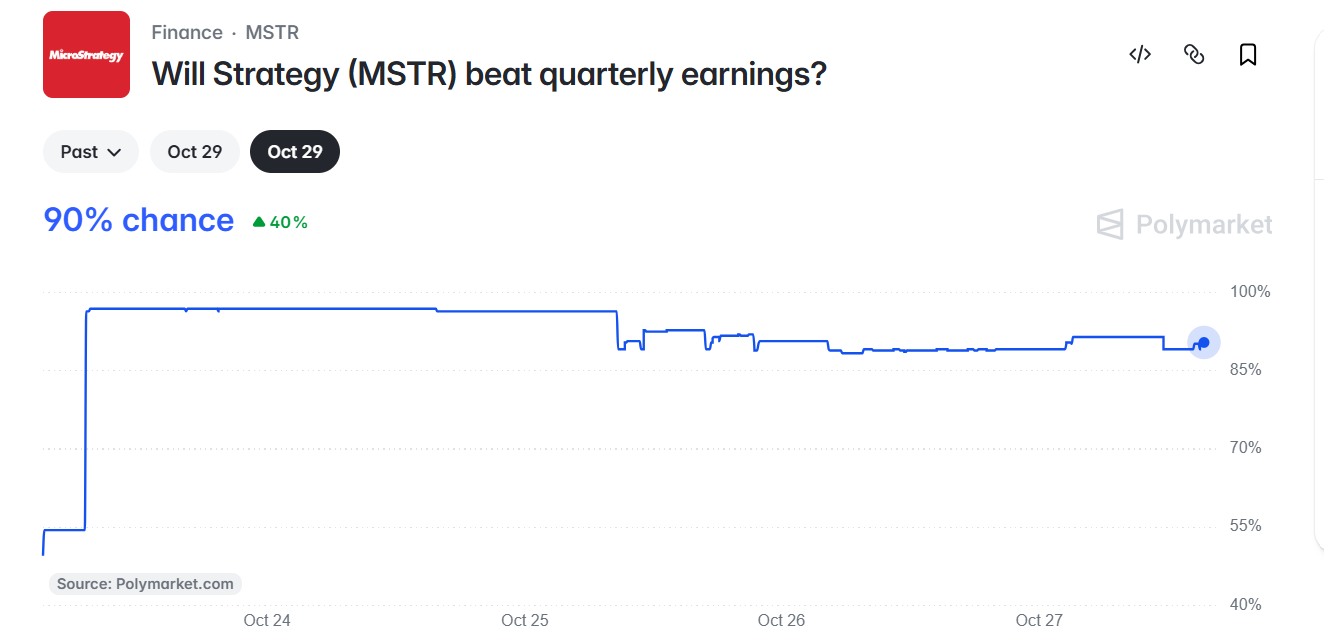
If Strategy earnings come in as bullish as the market is expecting, MSTR stock price could bounce from the support at $140 and target the early October highs above $170.
MSTR Stock Outlook as Price Struggles Near $140
MSTR stock has been on a downtrend that began in late September and has pushed the price from $171 on September 23 to $140.
The Fib retracement shows Strategy shares are sitting close to support at the 78.6% Fib of $141. Closing below this support for three straight days could cause a decline to $133.
The Chaikin Money Flow (CMF) that measures buying and selling pressure has a negative reading of -0.16, suggesting that sellers have the upper hand. However, MSTR stock is defending the support at $140, suggesting that traders might be awaiting the release of Q3 earnings.
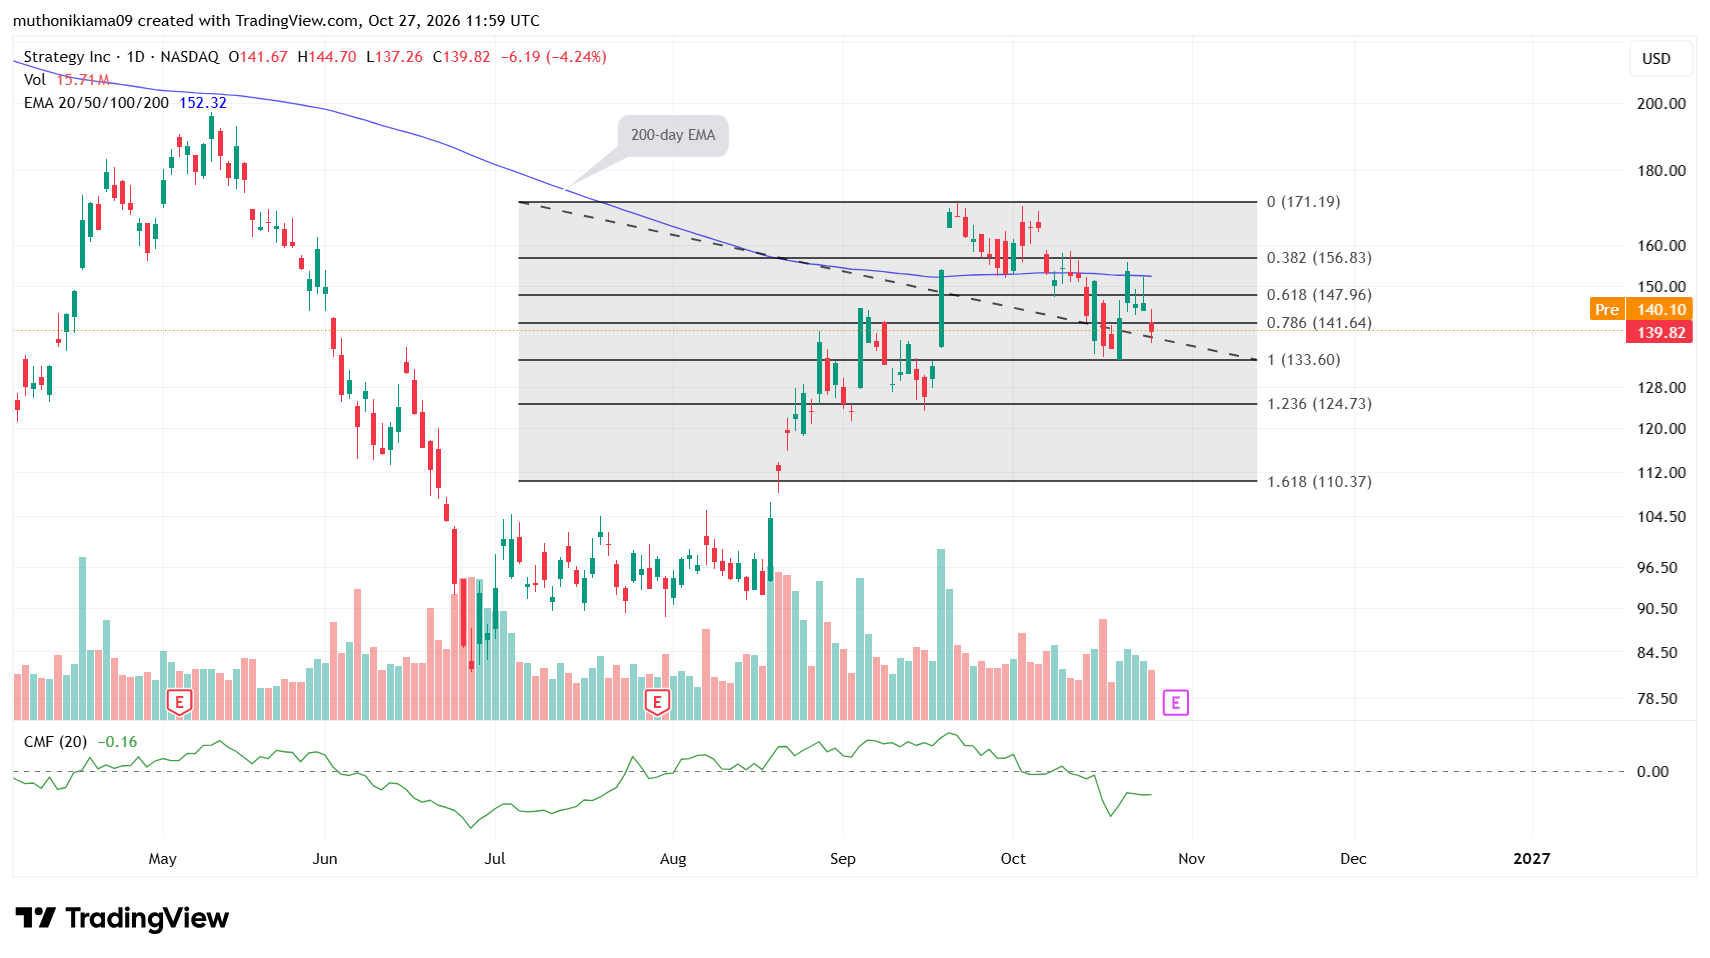
If the earnings results are bullish, it could support a bounce to the 61.8% Fib of $147. A move above the 200-day EMA of $152 is also needed to confirm a strong trend reversal.
Zooming out on the higher weekly timeframe filters out the noise. The weekly chart shows that MSTR stock has formed a bull flag, suggesting that the current drop might be a short term correction before the price resumes the uptrend.
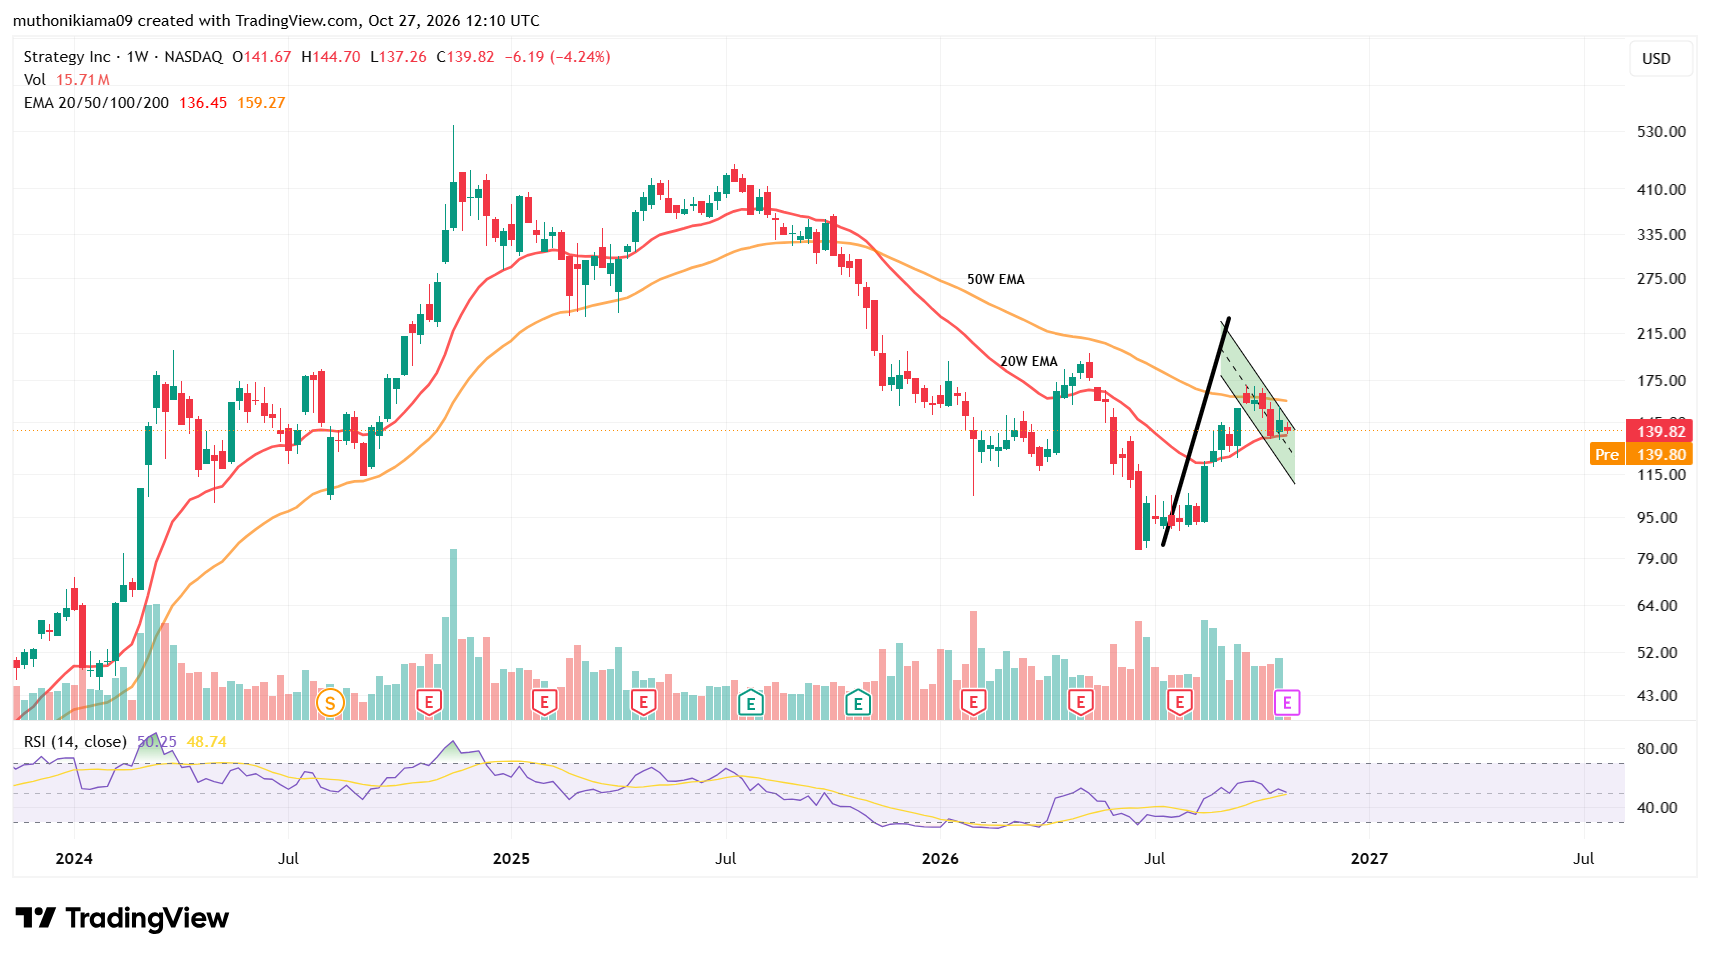
MSTR also remains above the 20-week EMA at $136. Falling below this EMA could invalidate the bullish outlook. Conversely, moving above the 50-week EMA of $159 might signal a shift in the short-term trend to a bullish one.