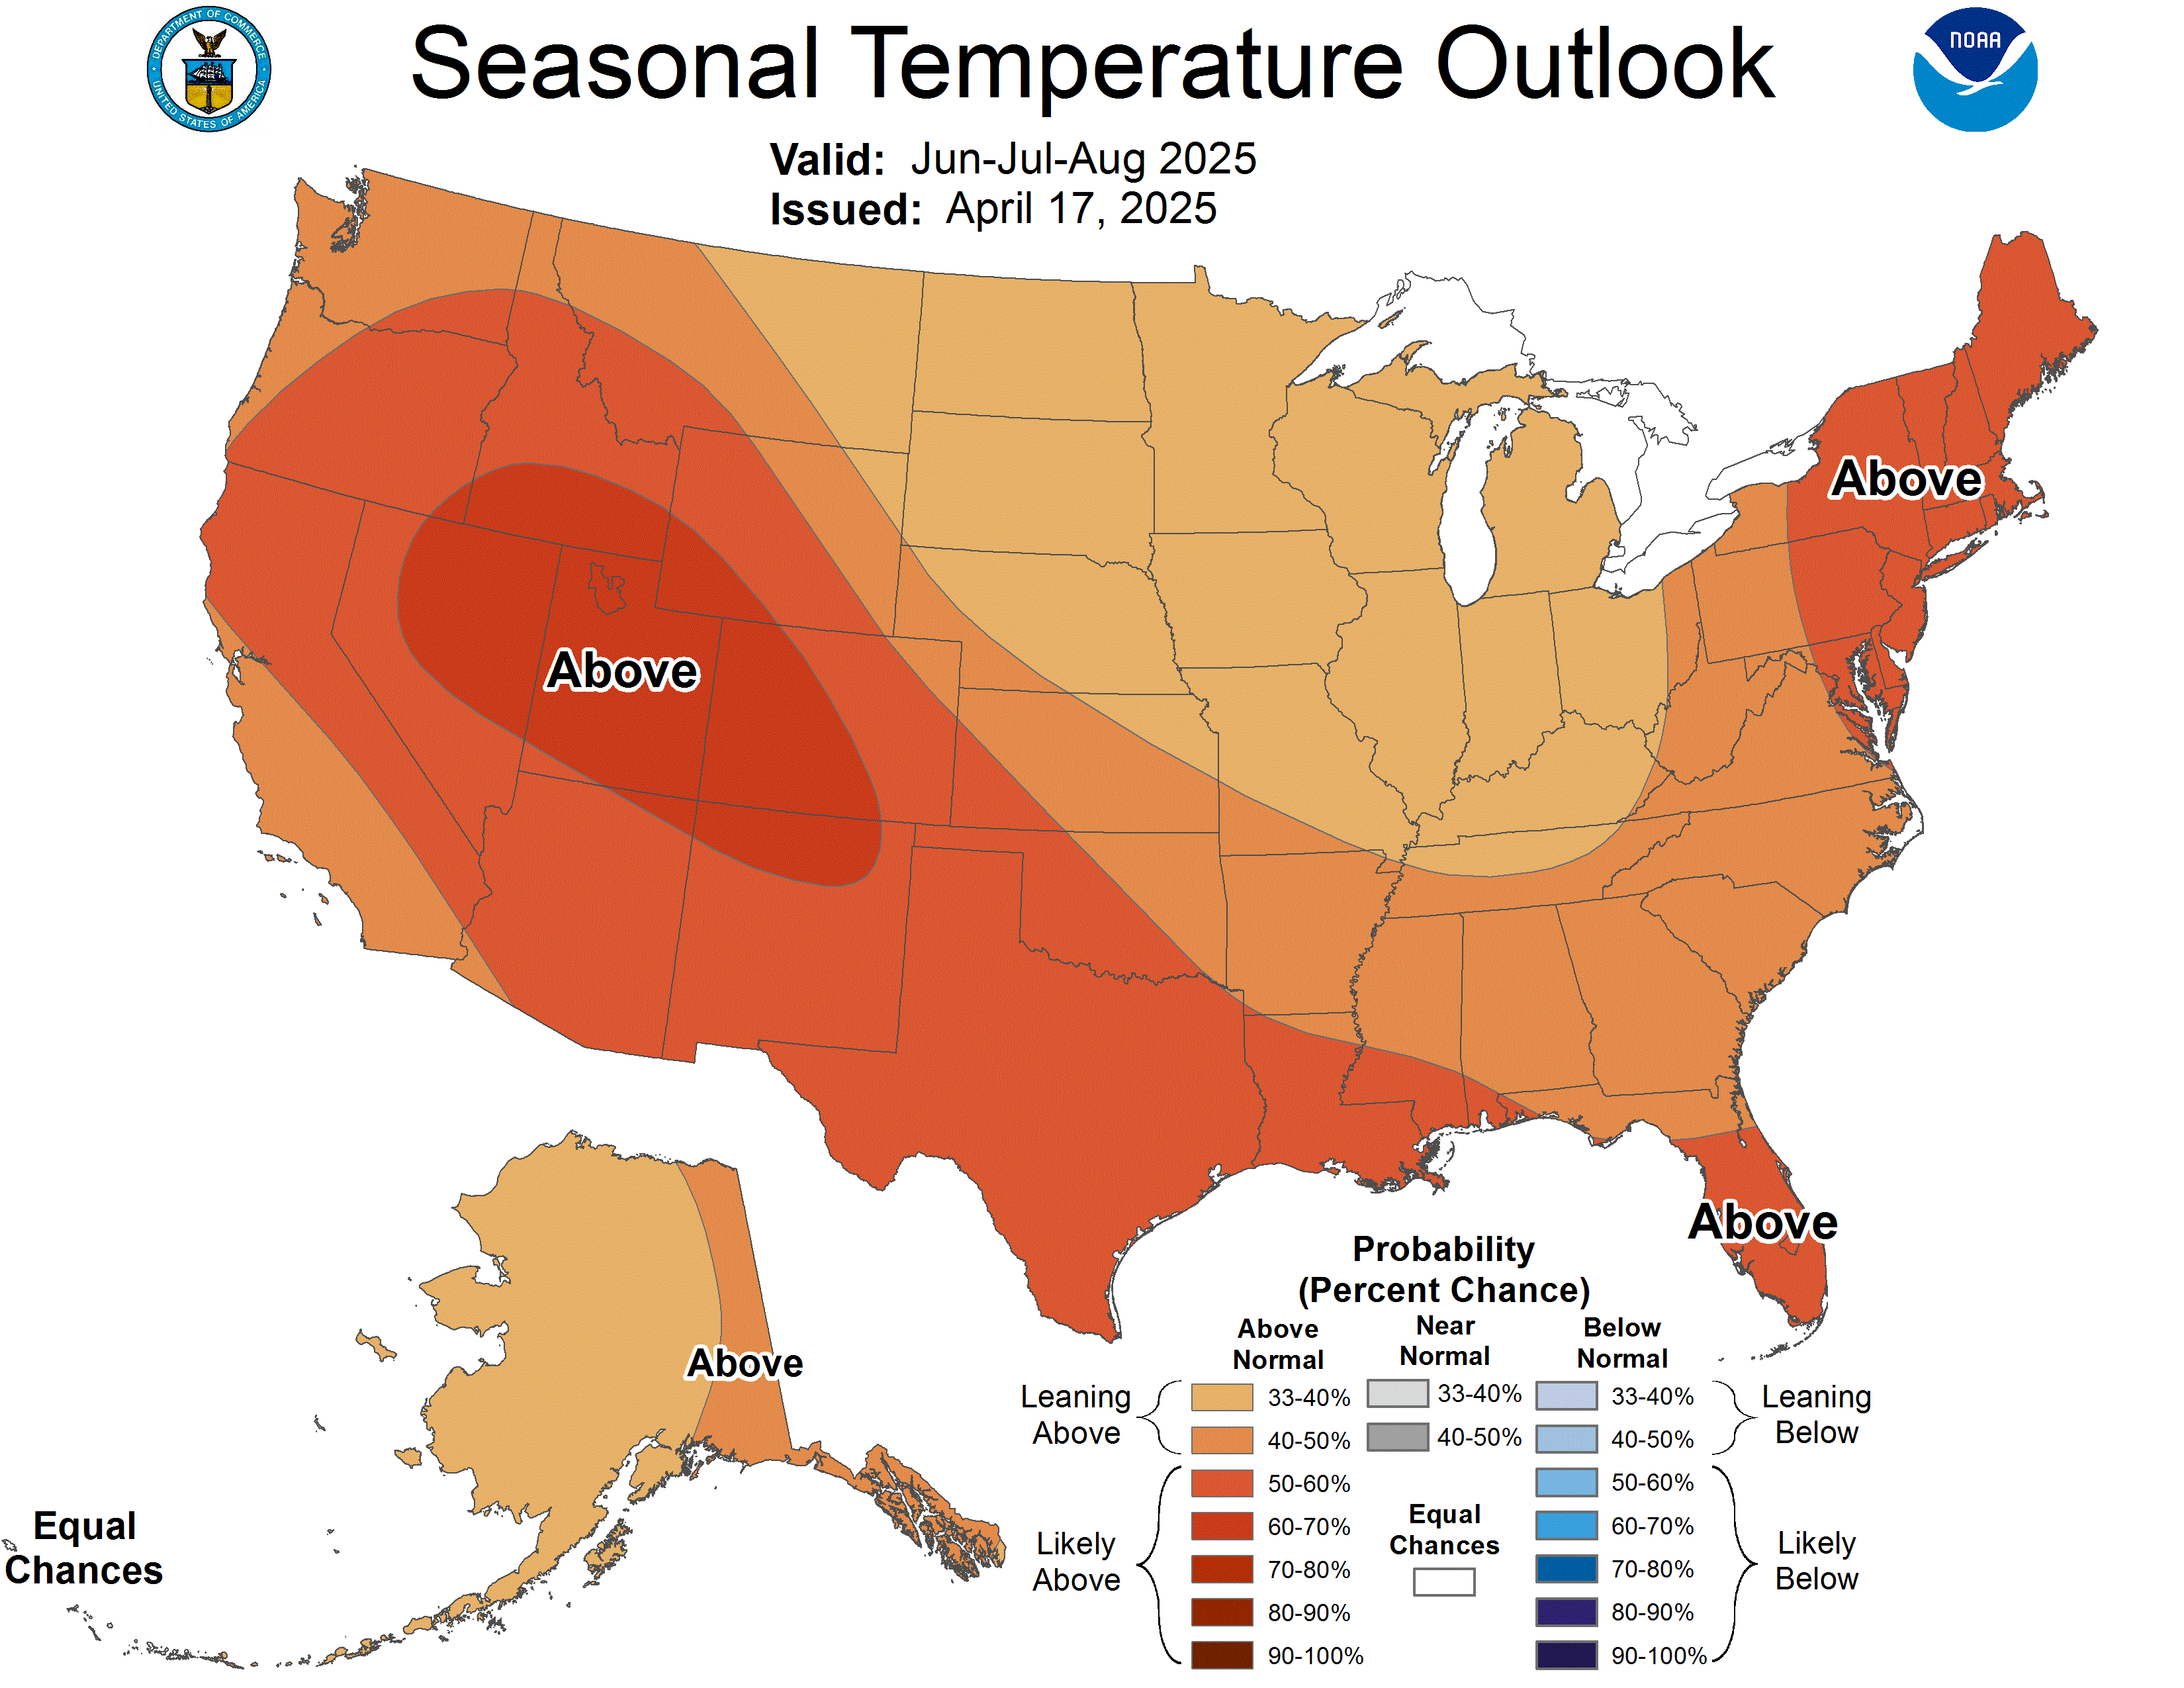
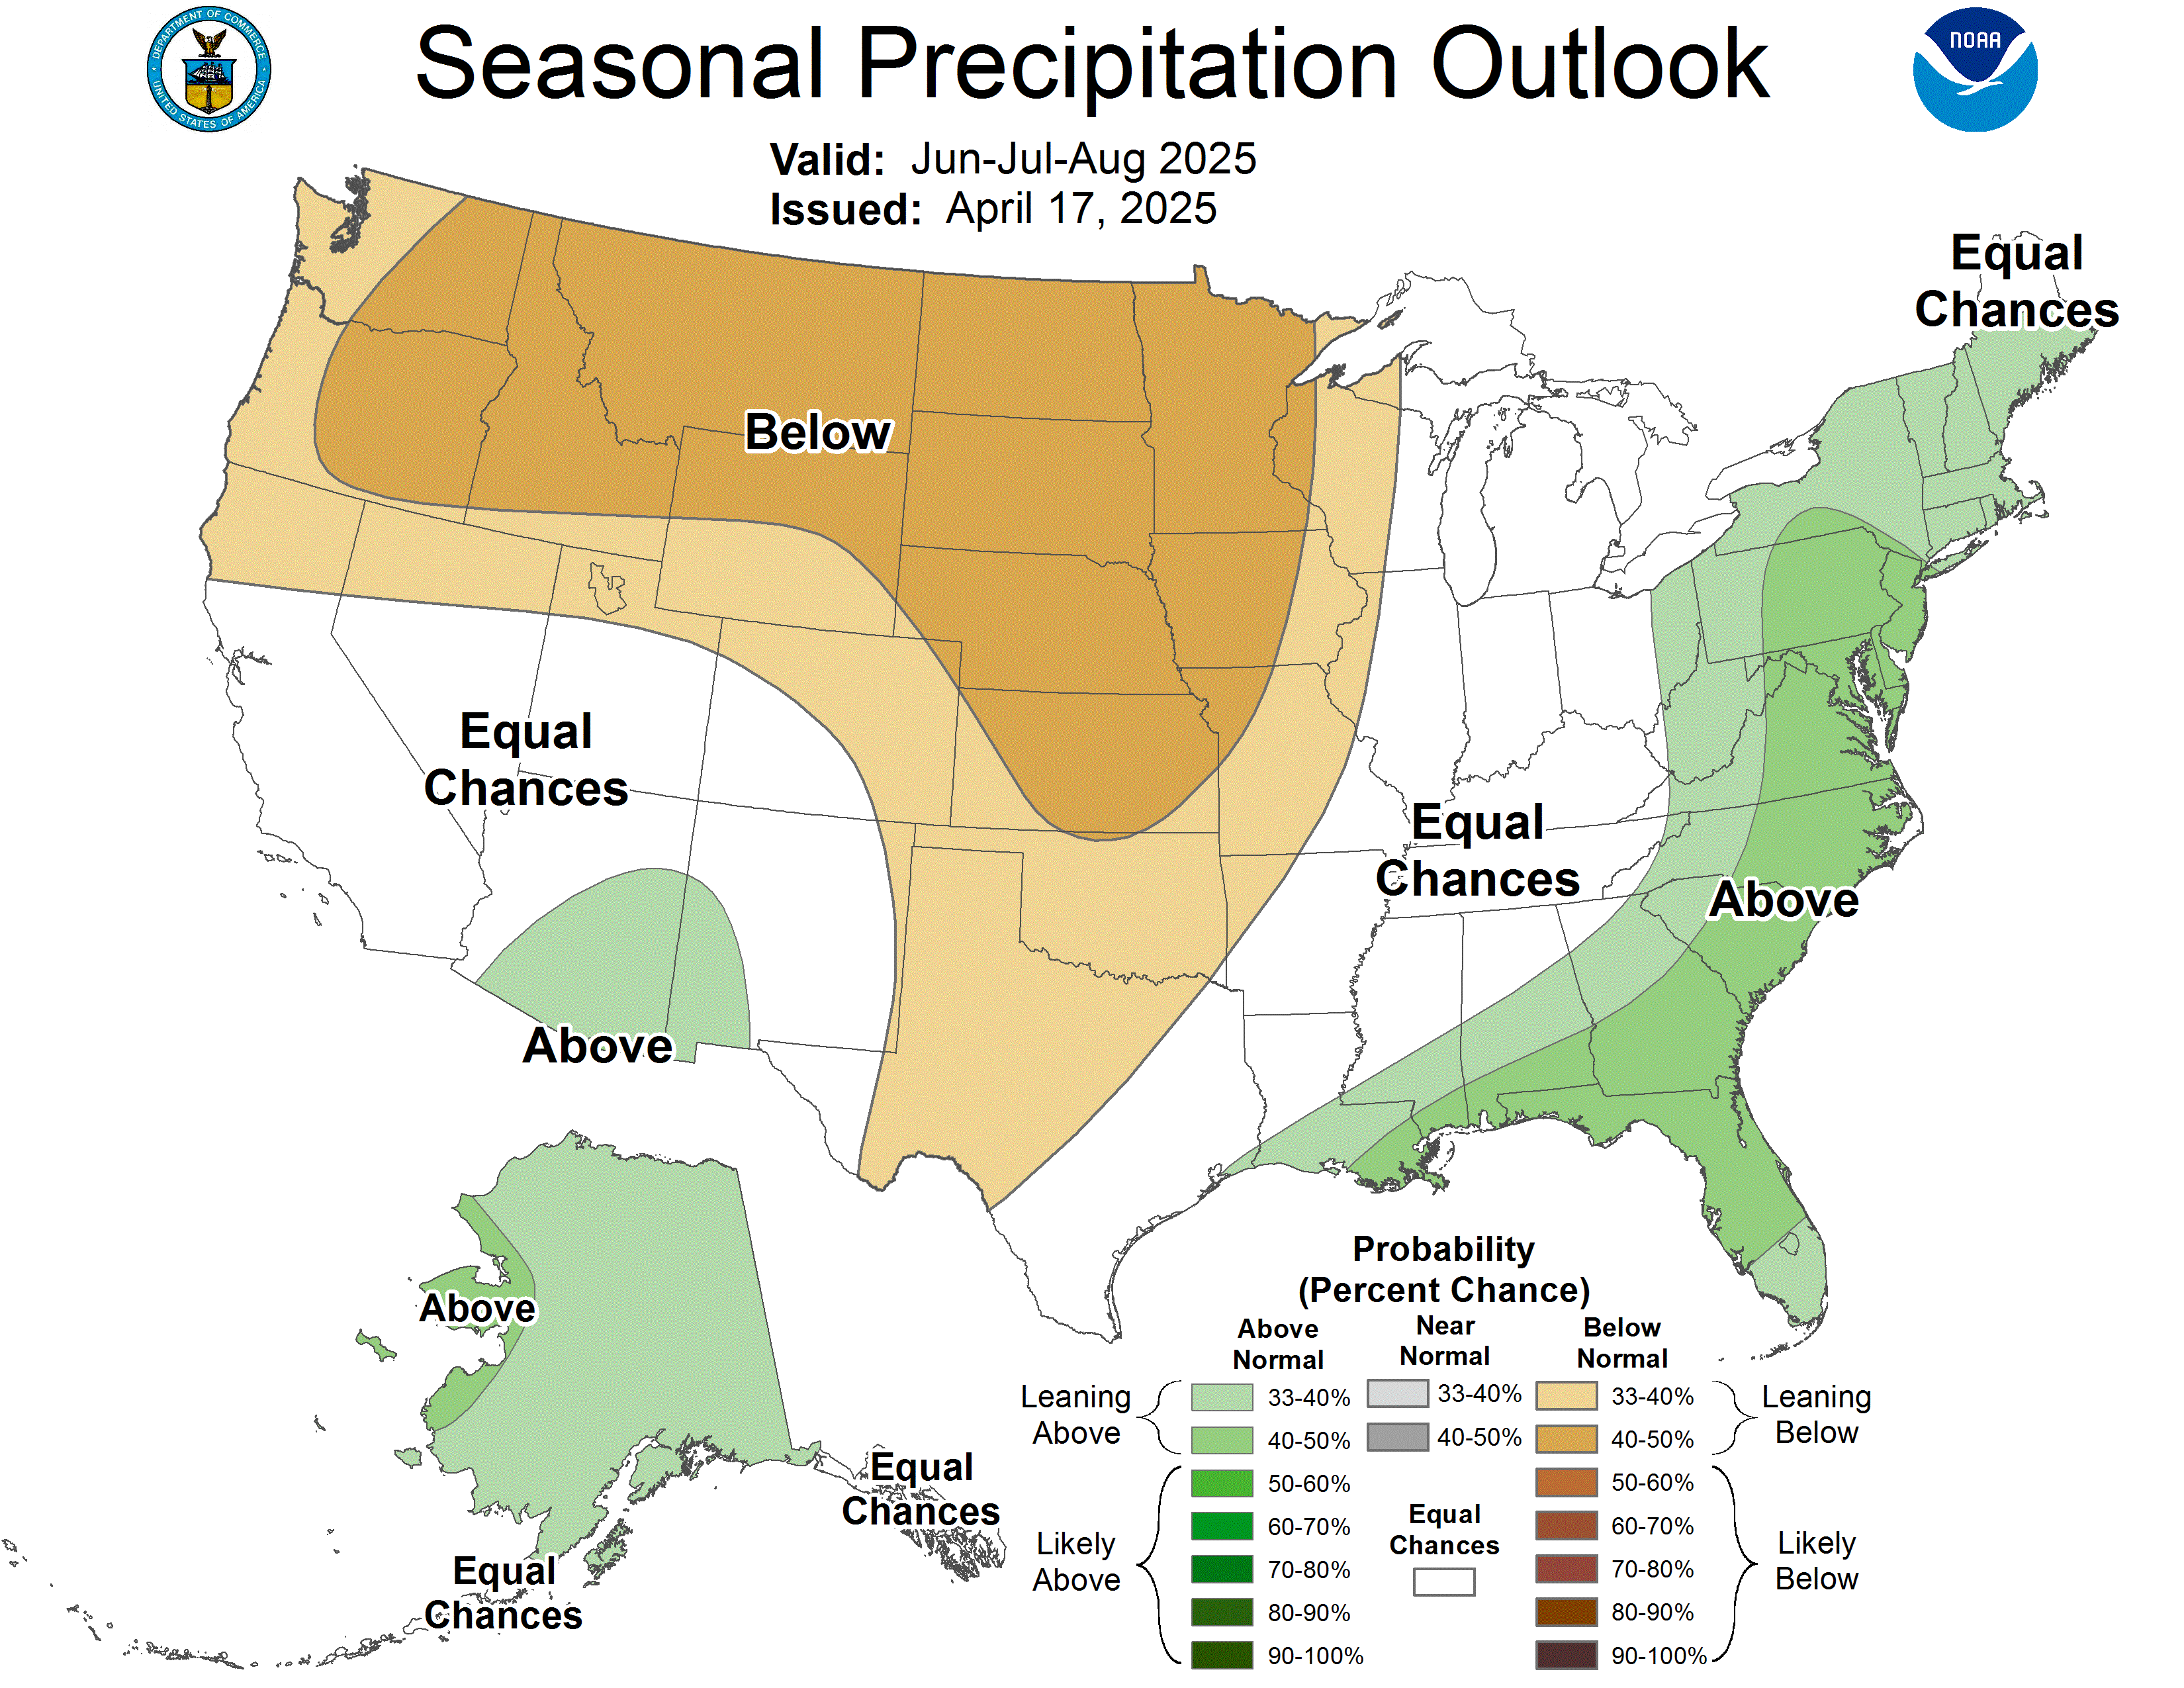
With the winter season quickly approaching, Americans want to know whether they should expect to cope with more or less snow than usual in the coming months. Fortunately, NOAA regularly issues maps with information that meteorologists can use to make predictions about what might be possible this winter.
Unfortunately, a meteorologist has just released a new map that visualizes the flaws in past NOAA outlooks, which could make a major difference. Here is everything you need to know about how that could affect the amount of snow you will face.
Where More Snow Than Expected Could Fall This Winter Based on the New Map
Mark Margavage is a meteorologist who majored in Earth and Environmental Science and graduated from Wilkes University in 2016. On October 17, 2026, he published a new map visualizing how inaccurate NOAA maps have been on average during past El Niño winters, like the one that is about to happen.
When NOAA published its seasonal temperature outlook map for December 2026 through February 2027 on October 15, it overlapped with Margavage’s map in a pivotal way. All of the full states and most of the partial states where the agency has overestimated temperatures during previous El Niño winters were covered in warm colors. That indicates that NOAA’s Climate Prediction Center (CPC) is forecasting that those states have a probabilistic likelihood of facing above-average temperatures this winter.
If the average overestimations Margavage pointed out hold during the upcoming winter months, snowfall expectations that are based on NOAA’s outlooks could be off. As a result, residents in the following areas should be prepared for the possibility that more snow could fall in their area than currently expected. That is the case because, according to Margavage’s map, NOAA outlook maps have overestimated how warm, on average, the following states have been during El Niño winters:
- All of Washington, Idaho, Montana, Wyoming, North Dakota, South Dakota, Minnesota, Wisconsin, Vermont, New Hampshire, Maine, and Oregon.
- Northern California, Northern Nevada, Northern Utah, North and Northwest Colorado, Northern Nebraska, Northern Iowa, the Northern Tip of Illinois, Northern Michigan, North and Northwest New York, Northwest Pennsylvania, Northern Arizona, Northern New Mexico, Northwest Massachusetts
It is important to note that more snow than currently expected doesn’t mean that those states will necessarily face greater accumulation than in an average year. Instead, it just means that current forecasts could be underestimating how much snow could fall in their area.
According to NOAA’s seasonal precipitation outlook, some of the full and partial states where temperatures have previously been overestimated could be wetter than average. The following areas, where there could be additional moisture and lower-than-expected temperatures, have the highest potential to outpace current snow expectations:
- Southwest Oregon, Northern California, Northern Nebraska, Southern South Dakota, the Southeast tip of Minnesota, Southern Vermont, Southern New Hampshire, and Southern Maine.
Where Less Snow Than Expected Could Fall This Winter Based on the New Map
Margavage’s map also showed that NOAA has a history of underestimating temperatures in much of the country during El Niño winters. In the following regions, if the historical pattern holds, there is a higher chance of warmer temperatures than NOAA’s outlook suggests, making snow less likely to form. According to Margavage’s map, NOAA outlook maps have underestimated how warm, on average, the following states have been during El Niño winters:
- Florida, Arkansas, Tennessee, Kentucky, South Carolina, North Carolina, Virginia, West Virginia, Georgia, Alabama, Mississippi, Louisiana, Texas, Oklahoma, Kansas, Missouri, Indiana, Ohio, Washington D.C., Maryland, Delaware, New Jersey, Connecticut, Rhode Island
- Southern California, Southern Nevada, Southern Utah, Southeast Colorado, Southern Nebraska, Southern Iowa, everything but the Northern Tip of Illinois, everything but the Northern Tip of Arizona, everything but the Northern Tip of New Mexico, Southern Michigan, Southeast New York, Southeast Pennsylvania, Southeast Massachusetts
Any of the above-listed areas where snow only falls in particularly cold winter seasons will be extremely unlikely to see snow if the map’s pattern is correct.
NOAA’s Winter Outlook Maps and Mark Margavage Temperature Anomaly Map Explained
NOAA’s Winter Forecast has a clear bias during El Nino winters…
Ralph (@WeatherNut27) has created a visual comparison of their forecast vs what actually happened.
Here, I have created an approximate visual representation of the average forecast error (actual −… https://t.co/ynI4r49KF0 pic.twitter.com/mj3VGThL7y— Mark Margavage (@MeteoMark) October 17, 2026
On October 15, 2026, the National Oceanic and Atmospheric Administration’s Climate Prediction Center issued seasonal temperature and precipitation outlooks for winter 2026-2027. The maps that were produced for the National Weather Service detailed where the experts believe the evidence indicates above-, below-, or near-average temperatures and precipitation. While the maps don’t indicate snow levels, they are a very valuable tool to help understand which regions could face more or less snow this year, based on how wet and cold it will or won’t be.
For his map, Margavage looked at the 2014-15, 2015-16, 2018-19, and 2023-24 outlooks, which were all El Niño winters, as this year will be. He then compared them to the actual temperatures during those years and saw that the agency underestimated and overestimated the temperatures in states across America. In some places, the average temperature variance between the NOAA outlooks and the actual temperatures was off by the qualitative equivalent of two degrees. That kind of difference has the potential to make a substantial difference in this winter’s snowfall totals.
Next: Winter Storm Travel Kit: Safety Experts Share the Must-Have Items Drivers Often Forget