
Bitcoin price faced renewed pressure on October 17 as inflation concerns, regional tensions, and fund withdrawals weakened market sentiment. BTC price is still recovering to the all-time lows last month, and is steadily moving toward the psychological mark of $80,000.
The crypto markte fell by 0.93% over the past 24 hours to $2.74 trillion. Fear and Greed Index went down to 49 compared to 57 last week and this is neutral.


US-Iran War Raises Concerns Over Hormuz Shipping Security
The IRGC just targeted a US ship with a massive attack in the Strait of Hormuz. The Strait of Hormuz will be closed and any ship trying to cross will be set on fire.
Iran’s IRGC just launched a massive attack on a US ship in the Strait of Hormuz.
The Strait of Hormuz is closed and ships attempting to cross will be burned.
You have been warned. https://t.co/lkrFTex9NB
— Mojtaba Khamenei Commentary (@MojtabaKhamen) October 17, 2026
U.S. Central Command commander Admiral Brad Cooper said American forces and regional partners maintained control of the strategic waterway. He said approximately 400 commercial vessels crossed during the previous week, contradicting claims that Hormuz had completely closed.
Cooper also said U.S. operations had prevented at least $25 billion in Iranian crude exports. Further disruption could lift energy prices, potentially sustaining inflation and reducing investors’ appetite for cryptocurrencies.
U.S. annual consumer inflation reached 3.7% in September, adding pressure to an already fragile market.


Bitcoin And Ethereum ETFs Record Fresh Investor Withdrawals
The total net outflows of all U.S. spot Bitcoin ETFs reached $82.39 million on October 16, per SoSoValue data. Most of the withdrawals during the session were in the form of BlackRock’s IBIT valued at $71.78 million.
Every dollar of Ethereum outflow was from BlackRock’s ETHA, whose funds lost $69.68 million, continuing a streak of three sessions of outflows.
Spot Bitcoin ETFs Recorded $82.39 Million in Net Outflows, While Spot Ethereum ETFs Saw $69.68 Million in Net Outflows on October 16 (ET)
On October 16 (ET), spot Bitcoin ETFs recorded total net outflows of $82.39 million, led by BlackRock’s IBIT with $71.78 million in net outflows. Spot Ethereum ETFs recorded total net outflows of $69.68 million, marking their third consecutive day of net outflows, with all of the day’s net outflows coming from BlackRock’s ETHA.
— Wu Blockchain (@WuBlockchain) October 17, 2026
Earlier selling coincided with $974 million in liquidations and nearly $1 billion in ETF withdrawals during October.
Will Bitcoin Price Break Below $80k Soon?
BTC price traded at $81,568 on a four-hour chart dated October 17, 2026, as Bitcoin struggled below resistance. The Bitcoin price has been moving in a trading range between the $80,000 support and $82,000 resistance level since the price pull from the higher levels around $87,000.
The relative strength index was 44, a bit below the 50 level, indicating less buying pressure.
The MACD also had a bearish trend, with the main line reading at -332.25. It had a signal line of minus 331.59 and a histogram of minus 0.65 with very little difference between the two.
A four-hour closing Bitcoin price above $82,000 would constitute an initial recovery, and support would have to hold during a subsequent test. If that occurs, the Bitcoin long-range prediction will be a move for $83,500–$84,000, where recent rebounds had to deal with selling pressure.
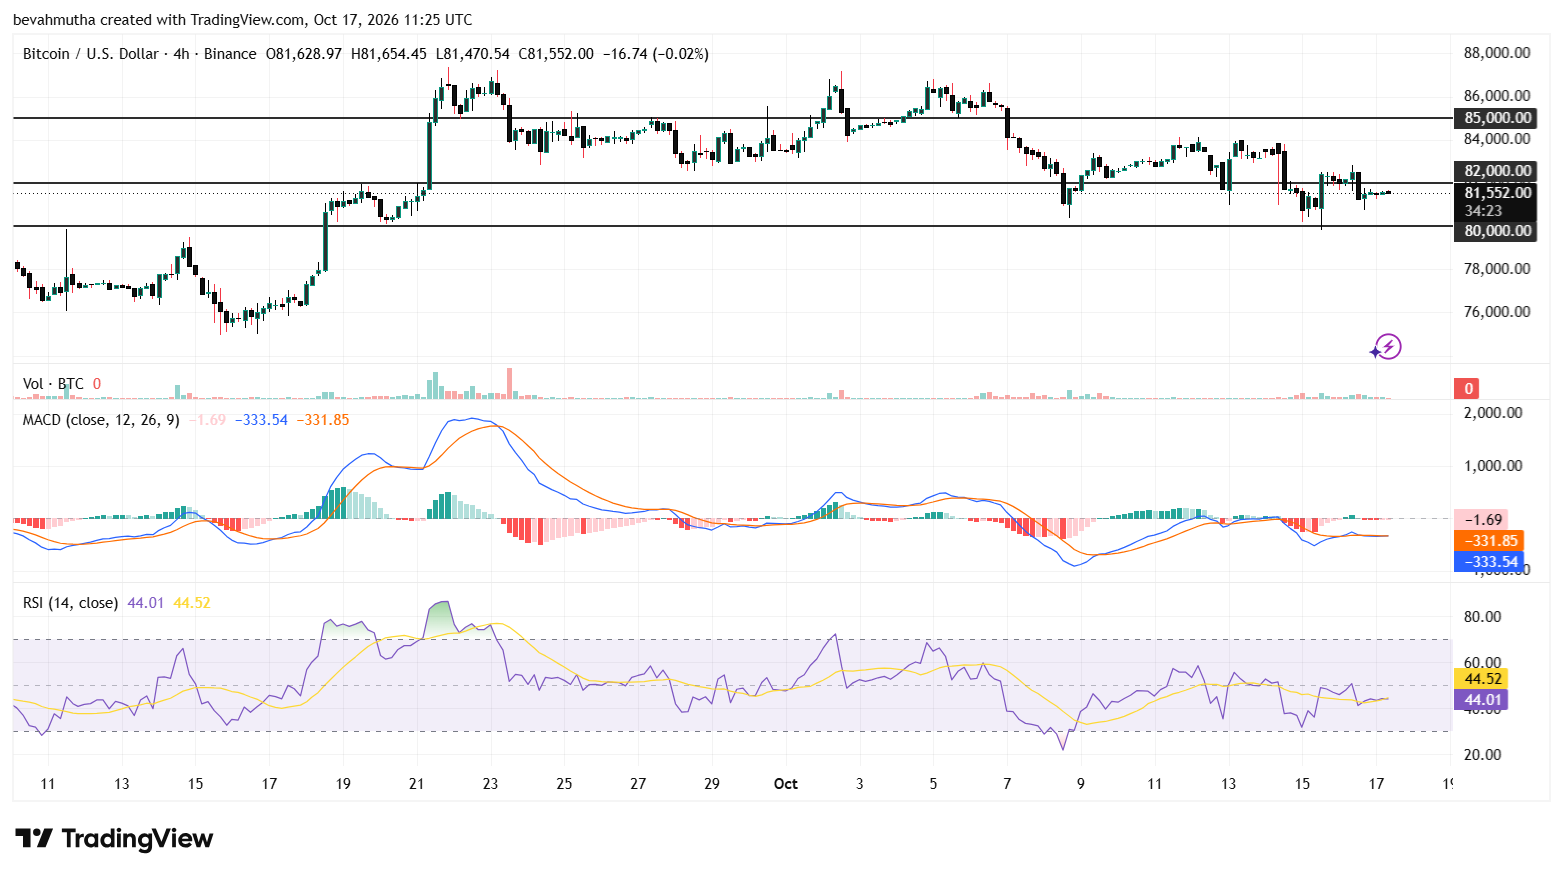
On the downside, rejection near $82,000 would leave Bitcoin price vulnerable to another test of the chart’s $80,000 support. A decisive four-hour close below that boundary could shift attention toward $78,000, where earlier trading activity formed a price cluster.