
Over the past 24 hours, NEAR Protocol [NEAR] faced some of the biggest losses among the top-20 crypto assets by market capitalization. The altcoin has registered a 10.53% price slide in a day and a 12.24% drawdown over the past week.
The losses were quite pronounced when compared to Bitcoin [BTC], but not so poor when compared to other leading AI sector altcoins.
The sector-wide performance in the past week, alongside a 2.2% dip across the entire altcoin market, meant a bearish short-term bias was warranted. Here’s a closer look at the NEAR price charts across timeframes.
NEAR falls toward 30-day price low
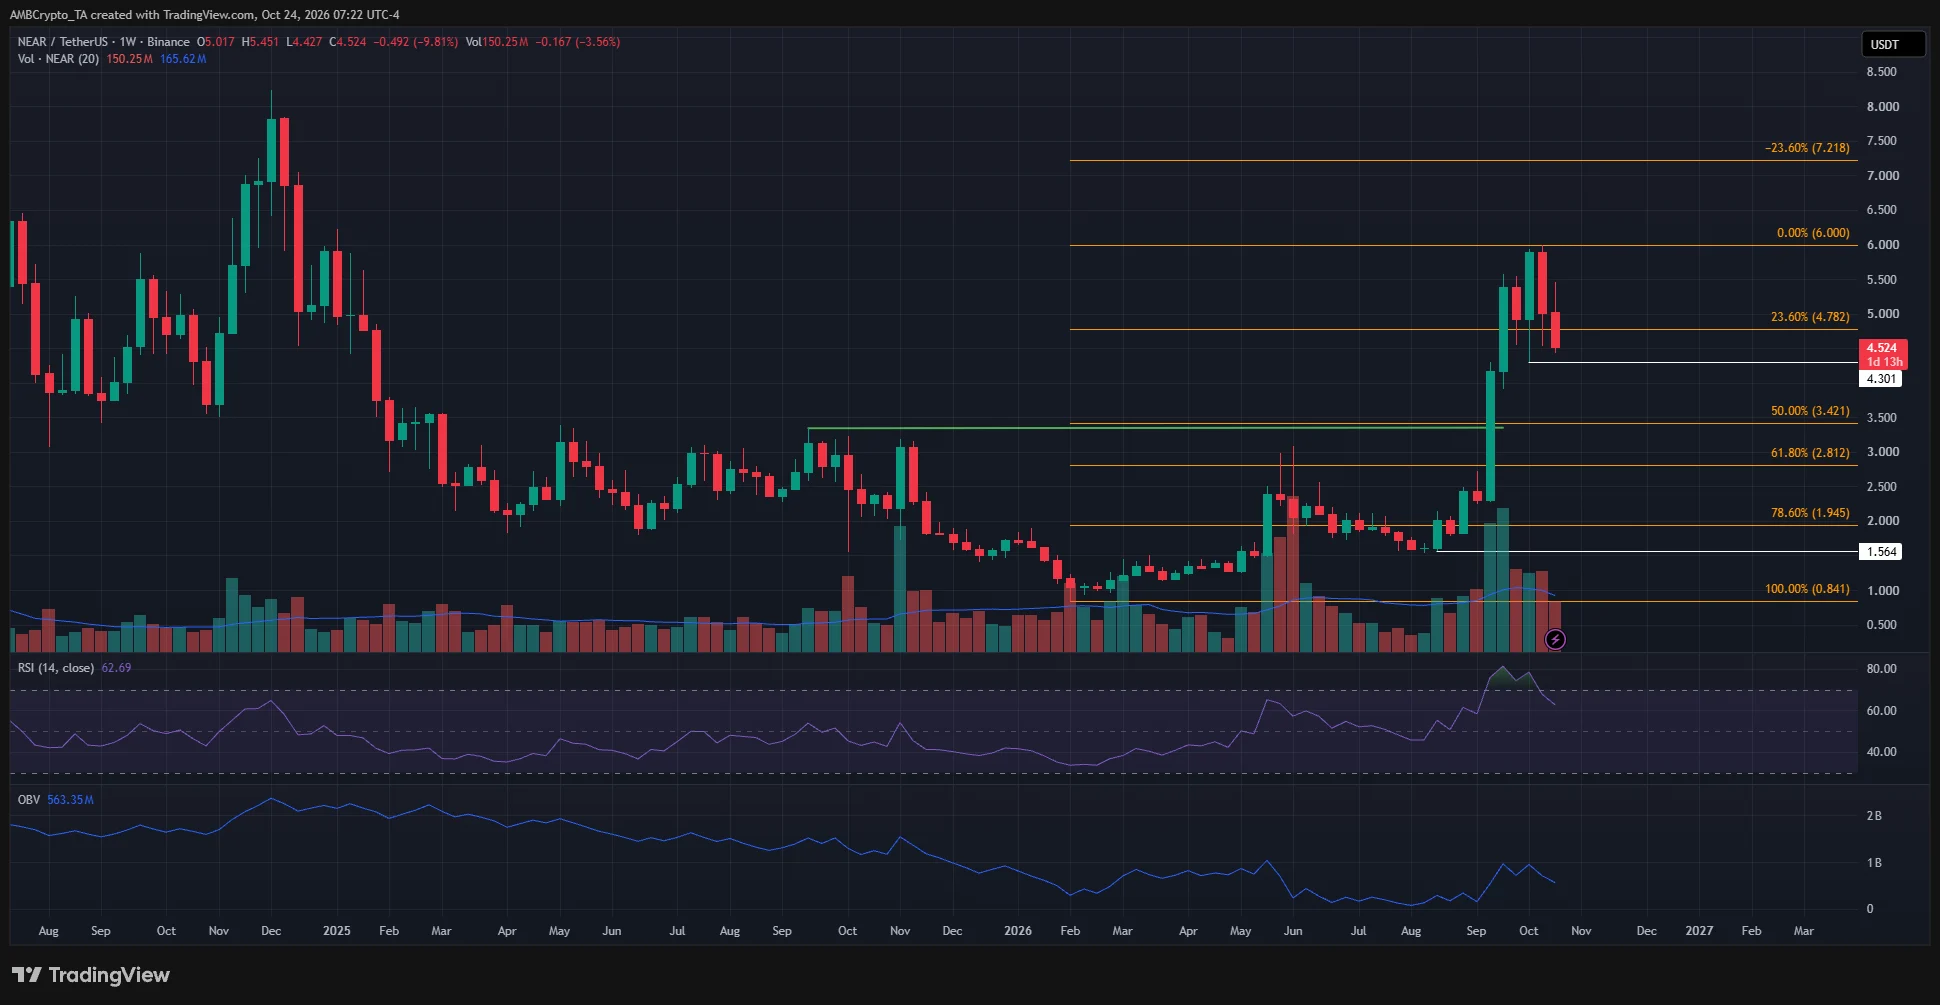
The downtrend of 2025 registered a swing point, a lower high, at $3.34 in September 2025. A year later, the bullish swing structure break came when this high was breached.
The recent losses were part of a pullback within the upward move that extended from $0.84 to $6.00.
The weekly RSI was cooling down from its extension into overbought territory above 70, while the OBV challenged yearly highs to underline steady buying pressure.
The Fibonacci retracement levels (orange) showed that a pullback to $3.42 was likely. A deeper correction to $1.94 and $2.81 would remain part of a healthy longer-term trend.
Why NEAR traders must watch THIS short-term demand zone
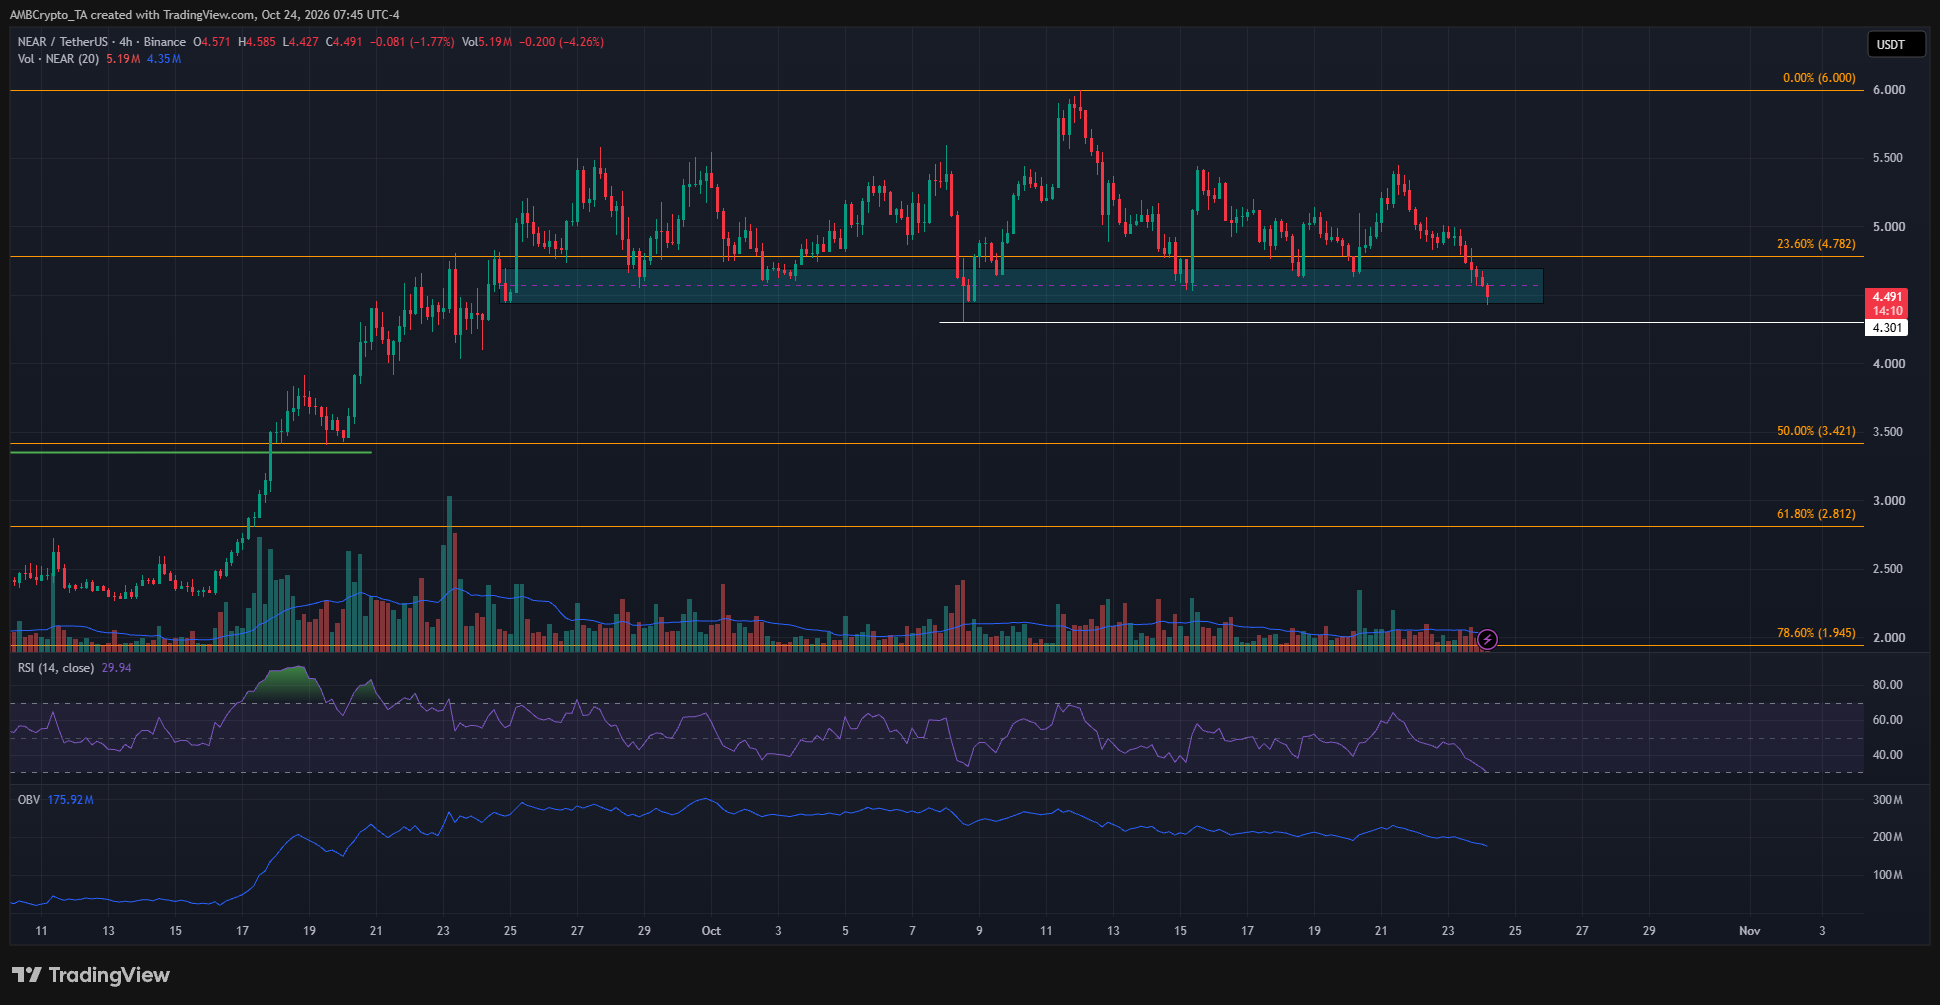
For a month, NEAR bulls have held their own at the $4.50 demand zone. Incidentally, the $4.30 anchor level was the one that kept the bullish bias alive on the 4-hour timeframe. The RSI has dropped below 30, while the OBV has also steadily trended downward over the past two weeks.
Though the indicators highlighted recent bearishness, it is $4.30 that dictates the next move’s direction. If lost, swing traders can flip their bias bearishly.
As things stand, NEAR could be a buying opportunity in the $4.44-$4.70 price zone.
Final Summary
- NEAR Protocol has a bullish structure on the weekly chart but could see a retracement toward $3.42 or even lower in the coming months.
- Over the next week, NEAR buyers have to keep hold of the $4.30 level to maintain the H4 bullish bias.