Uniswap (UNI) price is down 3.87% today, October 30, to trade at $6.87 at the time of writing. The drop mirrors the downtrend across the broader crypto market, where Bitcoin (BTC) and Ethereum (ETH) have dropped below $78,000 and $2,300, respectively, following a theft of $6.3 billion from the Binance exchange.
As CoinGape reported earlier, the Binance hack is the biggest in crypto history. However, Standard Chartered analyst Geoffrey Kendrick now forecasts that this event might be one of the factors that pushes UNI price towards $100.
Standard Chartered Flips Bullish on Uniswap After Binance Hack
Kendrick opines that the breach on Binance could see people start to shift away from centralized exchanges (CEXs) to decentralized exchanges (DEXs)
If this happens, the share of DEXs such as Uniswap in trading relative to CEXs will increase, with the analyst attributing this outlook to why UNI price could reach $100 by 2030.
“The decentralized exchange (DEX) has never had any exploits, and the hack of the largest centralized exchange (CEX), in Binance, should see the ratio of DEX to CEX trading continue to increase,” Kendrick opined.
Standard Chartered had earlier predicted that the amount that is deposited and staked on DeFi platforms will reach $2.7 trillion by 2030. The bank says Uniswap will likely take the biggest share because its liquidity pools will see a 37 times growth in assets, and this will drive the price towards $100.
UNI Futures Volumes Soar 200% as Price Tests Multi-Week Support
Data from CoinGlass shows that futures volumes for Uniswap jumped by 221% on October 30 to reach $1.45 billion. This marks a huge leap from the volumes of $388 million that UNI recorded on October 29.
The $1.45 billion in futures volumes also marks the highest level seen since September 24, with this jump coinciding with a drop in Uniswap price to support at $6.40 for the first time since mid-September.
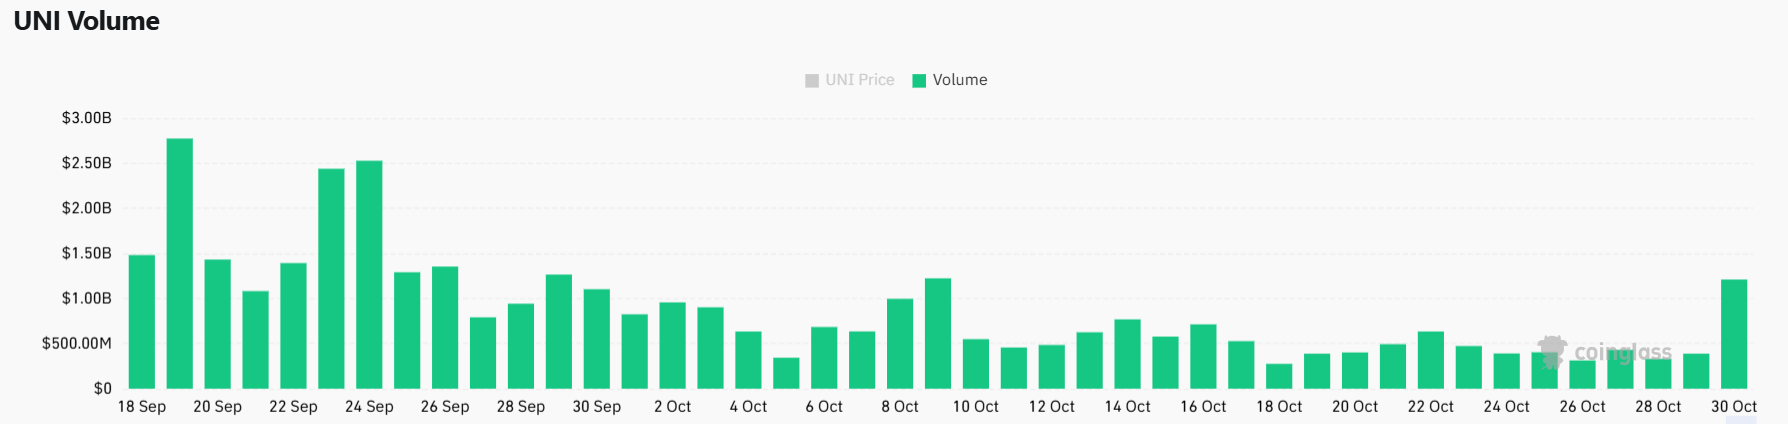
However, Uniswap’s open interest has dropped from $604 million to $587 million, suggesting that the futures volumes are not rising because traders are opening new positions in UNI. Instead, the jump is coming from liquidations.
Per CoinGlass, Uniswap recorded $10 million in long liquidations within two days. When long liquidations occur, it causes an increase in selling pressure that pushes the price lower.
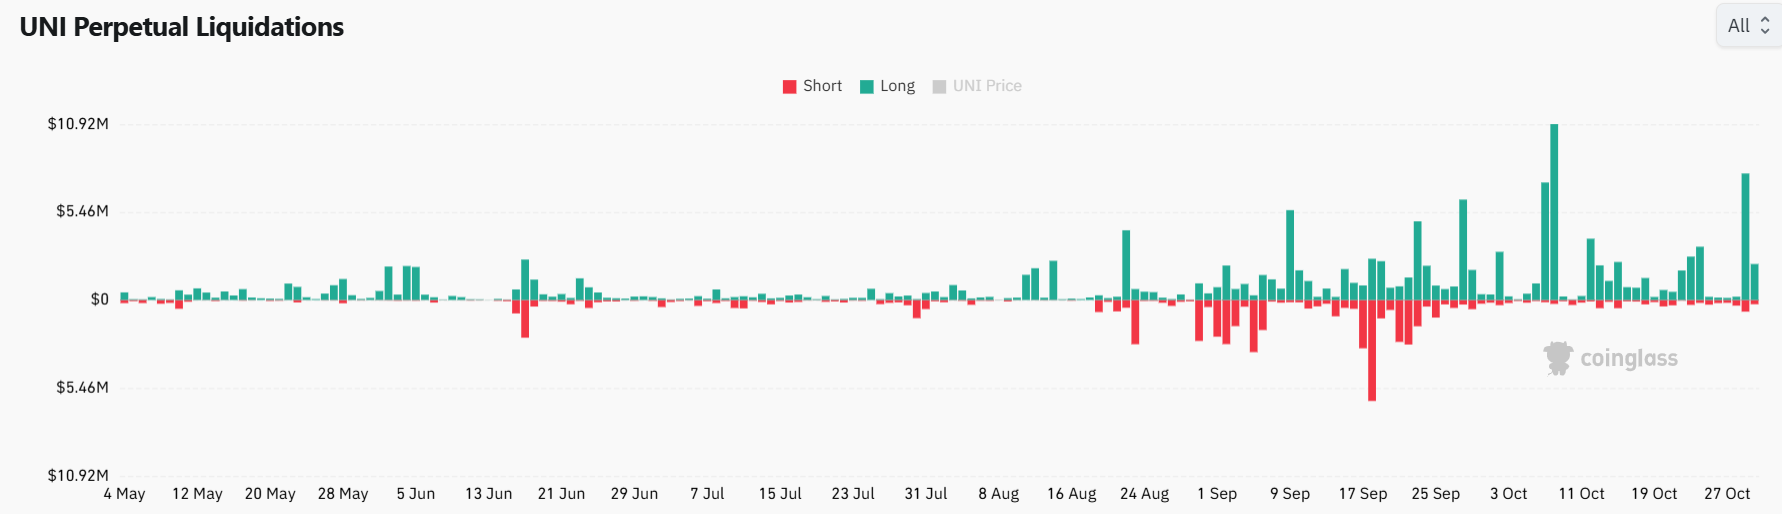
The declining open interest also suggests that Standard Chartered’s bullish reiteration on Uniswap price has not boosted the demand for UNI futures positions.
Uniswap Price Prediction as Bulls Defend Crucial Support Level
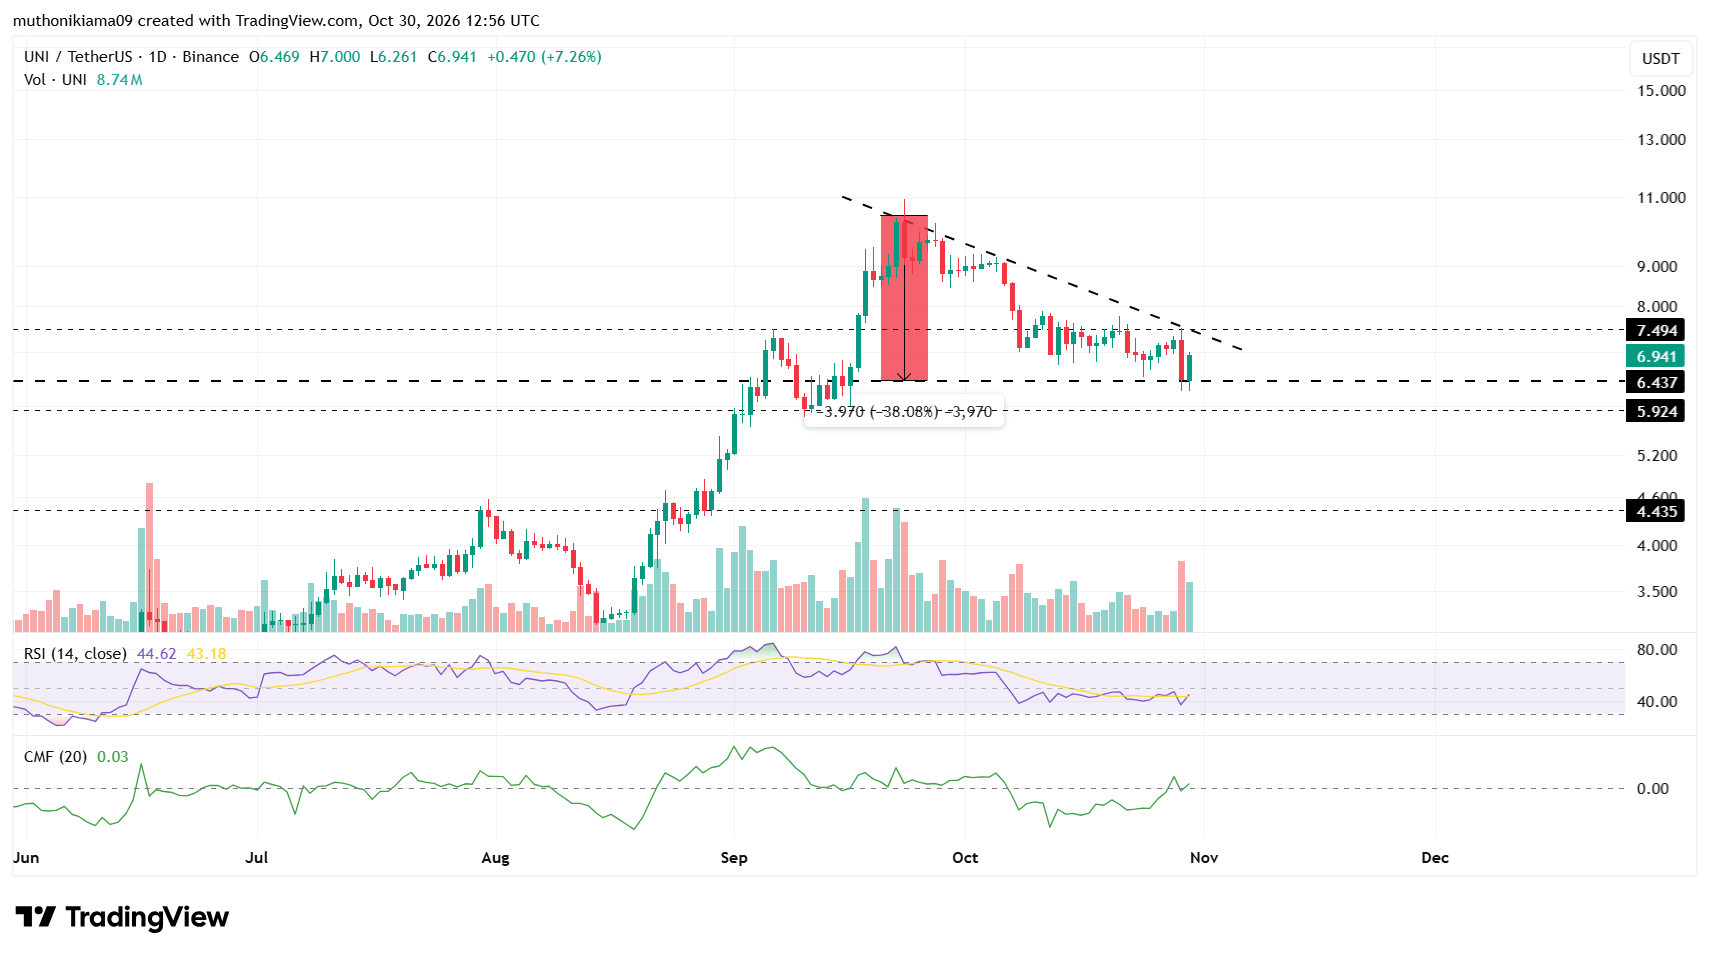
The one-day chart for Uniswap price shows that it is holding the support at $6.40. This is also the same support that would mark a breakdown from a falling triangle pattern if it does not hold.
If UNI closes below $6.40, it could cause a bearish move towards the support at $5.90. Failing to hold this support as well could push Uniswap price towards $4.43.
However, if Uniswap defends this support at $6.40, it might target $7.50 next. Closing above this resistance will confirm a bullish future Uniswap price outlook.
The CMF reading is at 0.03, which shows that the buying pressure on the daily timeframe is slightly outpacing the selling pressure. But, the RSI remains in bearish territory below 50.
Zooming in on the four-hour chart, however, suggests that bears are losing their grip because the RSI is making higher lows and it is nearing a crossover above the signal line. If it confirms this crossover, it could push the price to the resistance at $7.43.
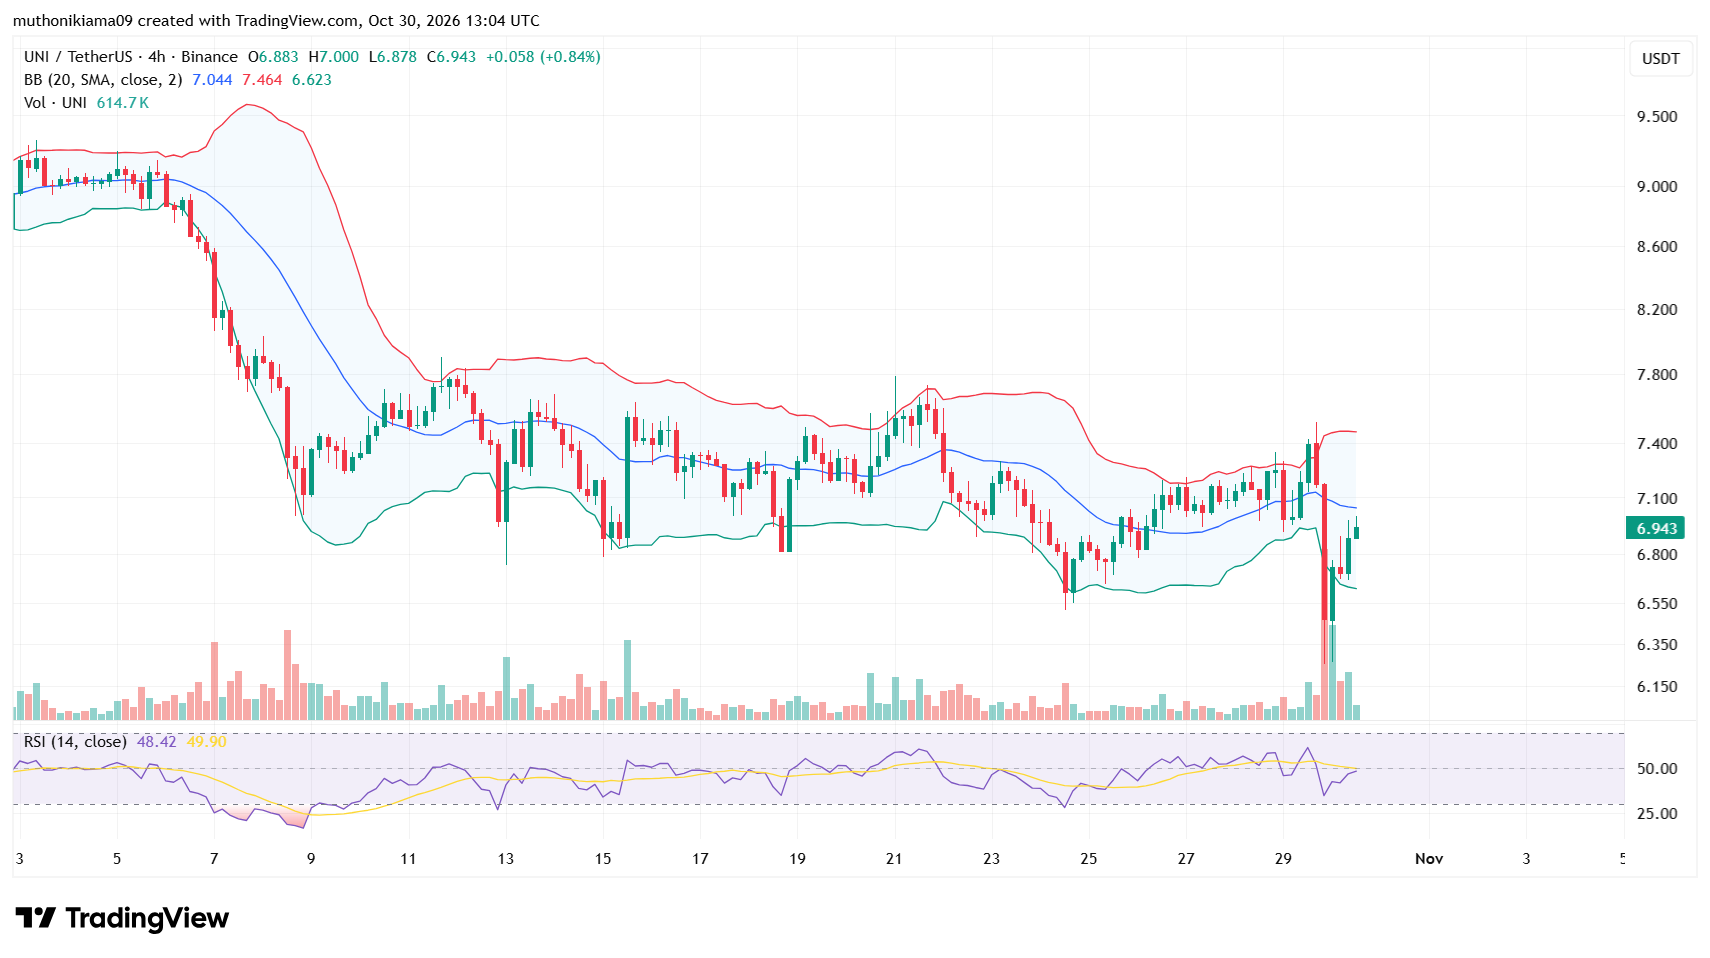
The widening Bollinger bands on this four-hour chart also suggest that the volatility around UNI is rising. The support on the lower timeframe lies at the lower Bollinger band of $6.62. Meanwhile, the middle band at $7 is acting as immediate resistance.