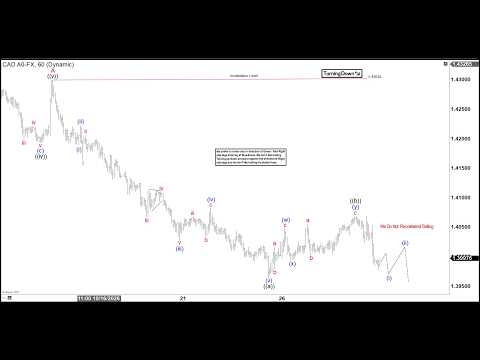
USD/CAD continues to develop a double three, or double zigzag, corrective Elliott Wave rally from the January 30, 2026 low. The initial advance in wave (W) completed at 1.42482 before the pair entered a corrective decline in wave (X), which ended at 1.3732. From that low, the market resumed its advance in wave (Y). The structure of wave (Y) is unfolding as a zigzag Elliott Wave pattern, suggesting that the broader recovery remains incomplete.
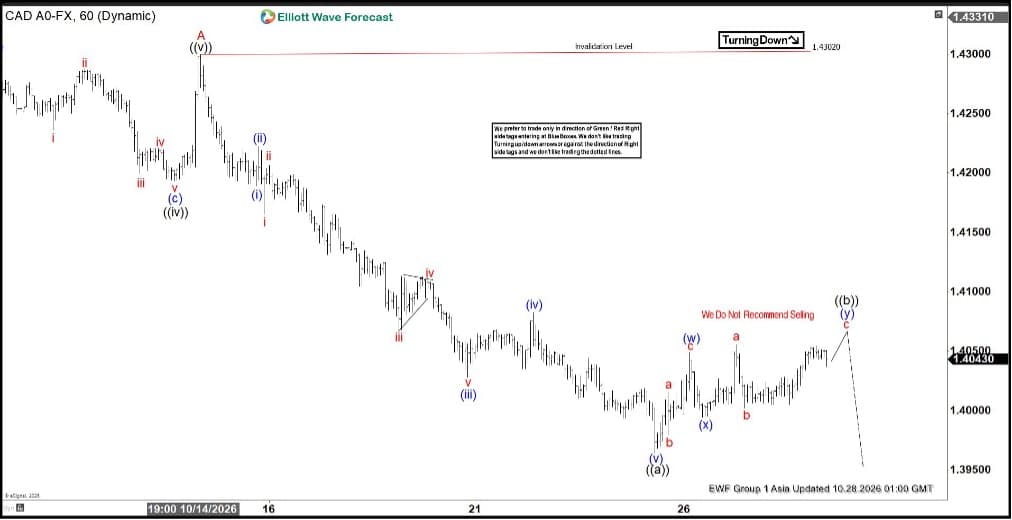
Within wave (Y), wave A finished at 1.4300. The pair has since started a pullback in wave B, which is also taking shape as a zigzag correction. This decline is expected to unfold in three waves before the larger bullish sequence can potentially resume. Looking deeper into the price action, wave ((a)) of the decline from wave A ended at 1.3964 and formed a clear impulsive structure. The subsequent recovery in wave ((b)) appears to have completed at 1.4068. Internally, wave ((b)) subdivided as a double three correction, a pattern often seen within complex corrective phases. Following that rally, USD/CAD turned lower again and began wave ((c)).
Even so, additional downside confirmation is still required. Specifically, the pair must break decisively below the wave ((a)) low at 1.3964. Such a move would strengthen the bearish near-term outlook and confirm that wave ((c)) is extending lower. Until that occurs, the possibility of another corrective sequence cannot be completely dismissed.
In the near term, the key pivot remains the 1.4300 high. As long as this level stays intact, rallies are expected to fail in either a three-swing or seven-swing corrective structure. Consequently, the Elliott Wave count continues to favor further weakness before the current pullback reaches completion.
USD/CAD 60 minute Elliott Wave chart
USD/CAD Elliott Wave [Video]